
Monday, November 18, 2013
Thursday, November 14, 2013
Typhoon Haiyan
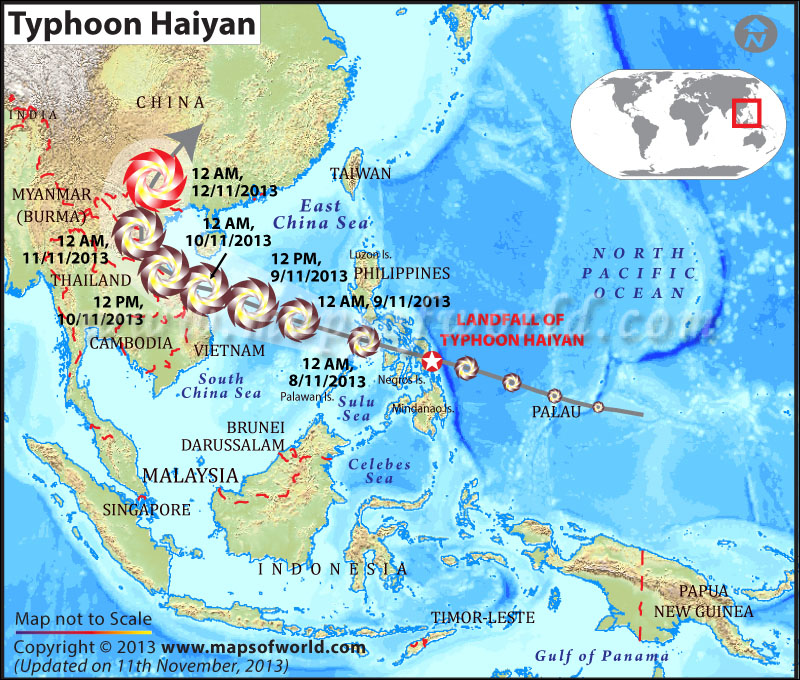
This map was well done tracking the path of the Typhoon that recently plowed through the Philippines. Not only does it show the impact of the typhoon and track the times, but it shows elevation of the surrounding waters, most important being the North Pacific Ocean where it originated. It also has great labeling so that the average person who isn't too familiar with the Eastern World can easily identify what is what.
Source: http://www.mapsofworld.com/world-news/super-typhoon-haiyan/
Tuesday, November 12, 2013
Example of a Bivariate Map

I thought that this map was done well with how they proportioned their symbols with the choropleth map. The houses have a nice transparency so can see the color of the data clearly through the symbols.
Monday, November 11, 2013
Irish Population in West Virginia

This is the map I created from the WV basemap and used the given data from census collected for the Irish population in WV. Keeping the Irish flag in mind being the reason for my color scheme!
Wednesday, November 6, 2013
Final Project Proposal
Map Project Proposal
-My map subject will be about tracing the moonshine
distilleries in the Tennessee and/or North Carolina territories where there are
quite a few. These will be legal moonshine distilleries of course.
- I’m interested in mapping this subject because of the show
‘Moonshiners’ on Discovery Channel. Also, the history is interesting.
-The map audience could be people who are interested in
visiting Moonshine Distilleries or who actually like moonshine.
-The type of map I’m envisioning is an antique looking map
with labels in an Old English Script.
-The scope of map would be the Tennessee and/or North
Carolina states
-The data that I found was from Ole Smokey Moonshine
Distillery in the Smokey Mountains, I visited this a few years ago but wasn’t
of age to try it. It was interesting because there were so many different
flavors, and moonshine has come a long way from what it was/is illegally. The
data ranges from the years 2007-2013.
-The basemap needed for my map would be State boundaries
that can be downloaded from ArcGIS with the important cities (the ones where
the regulated Distilleries would be). I'm thinking of a Dot Density map to specifically show the locations.
-I expect the production to be somewhat tedious with
labeling primarily and making it look really authentic.
-Some challenges that I perceive would be making it look
rustic, I really want it to look like what I’m envisioning, and this might be a
challenge since my artistic and creative capabilities are on the way side.

Source for picture: www.olesmokymoonshine.com
Sources of data:
Friday, November 1, 2013
Example of a Dot Density Map

I thought this was a neat example of a dot density map. It was done very well with the data and color symbology, also I can easily spot where the most oranges are produced by county in Florida.
Subscribe to:
Comments (Atom)